Unleash the Power of Your Data with Compelling Visualisations
In today's data-driven world, the ability to effectively analyze and communicate information is crucial. We can help you transform raw data into insightful visuals that tell a story, drive decisions, and enhance understanding. Whether you're looking to create dynamic dashboards for tracking key performance indicators (KPIs) or generate compelling reports that highlight trends and patterns, we have the expertise to bring your data to life.
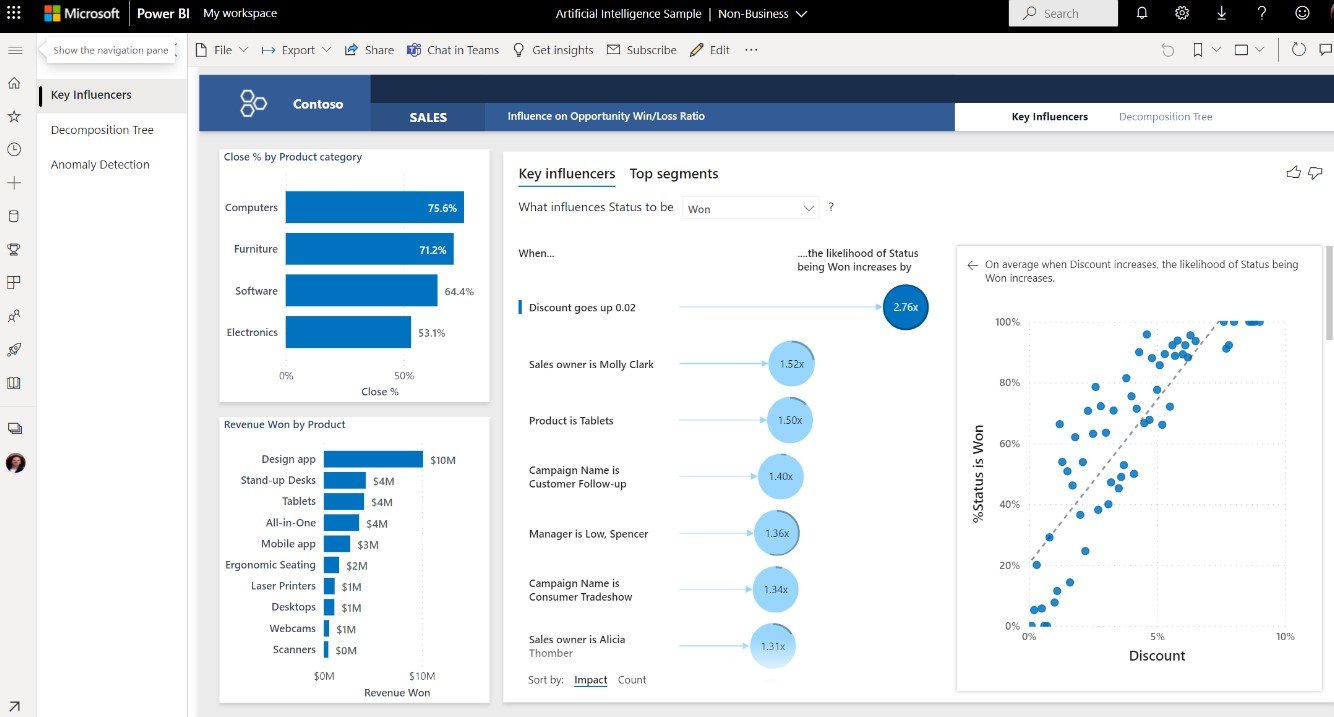
We leverage powerful tools like Microsoft Excel, Power BI, and the Power Platform to design bespoke visualizations tailored to your specific needs. From interactive charts and graphs to informative maps and dashboards, we can help you unlock the full potential of your data and gain a competitive edge. Contact us today to explore how our data visualization services can empower your business.